Using Analytics to Drive Costs Out of the Supply Chain

Using Analytics to Drive Costs Out of the Supply Chain

Here are five ways analytics are being leveraged to help companies do more with less.

In a business environment where taking actions based on gut instinct has been replaced by good decision-making supported by advanced technology, analytics has become a core necessity for companies.

Especially critical for companies that want to operate efficiently, productively, and profitably, analytics leverages current figures, historical data, dashboards, charts, and other tools to help companies make sense of their information.

In supply chain, analytics also uncovers patterns, generates new insights, and jumps in to substantiate (or refute) the many “seat-of-the-pant” decisions that supply chain and logistics managers must make on a daily basis.

“The relationship between advanced analytics and supply chain excellence is undeniable,” Gartner points out. “Leaders in supply chain have consistently credited analytics as a key differentiator to cope with complexity and capitalize on market opportunity. To follow suit, supply chain organizations are focusing on building strong analytics competencies.”

Data is the New Oil

Supply chains generate tons of data. So much so that many companies don’t even know what to do with all of the information that their operations are generating. Supply chain analytics helps those organizations make sense of all of that data, use it for good decision-making, and save some money along the way.

Recognizing that many companies are still on the early road to both harvesting data and successfully using analytics, Gartner says most have set their sights on fully leveraging the latter. According to a recent survey, 85% of organizations are either already using or planning to invest in advanced analytics/big data. “Supply chain organizations identified advanced analytics as the top emerging technology they currently have,” Gartner adds, “or will be investing in.”

5 Ways Analytics Drives Costs Down

The benefits of supply chain analytics are too great to be ignored, and include:

• Better outcomes based on accurate benchmarking.
• Improved organizational results that are both accountable and visible.
• Better visibility over global data (whether it’s for a single operation, a domestic company with multiple locations, or a global enterprise).
• Improved inventory management.
• Lower supply chain risk.
• Ability to respond quickly to both challenges and opportunities.

The benefits don’t end there. Analytics also helps to drive costs out of the supply chain. Here’s how:

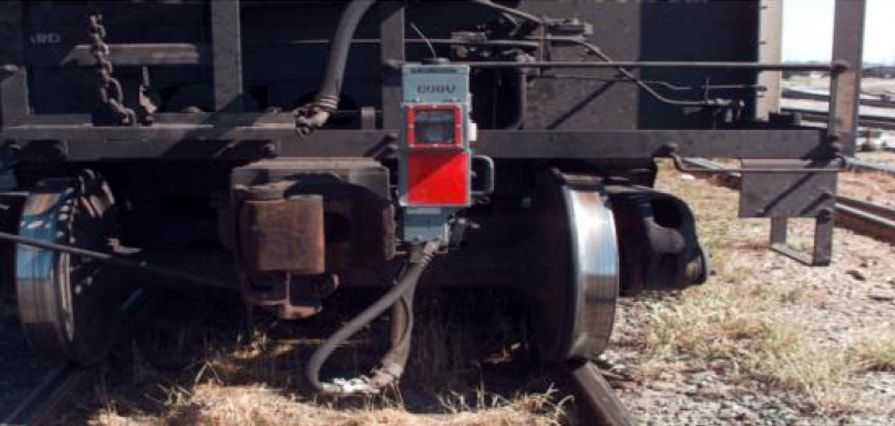
1) Highlight the impact of data quality. Let’s say a company has a long list of rail car maintenance expenses that typically run $200-$500 per line item. Then one day a $10,000 charge shows up on a list of over 1,000 different line items. This would be difficult to pick out of a tabular data set, but to a supervisor viewing a chart that tracks the maintenance expenses over time by line item, that $10,000 data point would stick out like a sore thumb. These anomalies are much more obvious when presented in the right visual fashion than, say, if someone is just reviewing invoices or a table of data.

2) Make better decisions. Companies that have accurate reliable data to work with can make better decisions across their organizations. Using the same $10,000 example from the last point, let’s say the 5-digit charge wasn’t an error, but it was a very expensive repair that could have been avoided. What caused it? What can we do to prevent it from happening again? Is it an erroneous point that needs to be corrected or is there something genuinely wrong that we need to address? By combining those answers with analytics, companies can effectively drive these and other costs out of their supply chains.

3) Drive continuous improvement. Analytics not only helps you identify the “bad” data points, but it also looks for numbers that don’t align with the rest of the information around them. For example, one IntelliTrans dashboard tracks dwell time at shipment origin or destination. Using number of shipments and total/average dwell time, the platform shows shippers what’s been waiting around where, and how much that dwell time is costing them. A red circle indicates an immediate problem that needs to be solve, while a greenish-blue one indicates that things are doing according to plan. By addressing the red flags first, users can enact changes that can have a notable impact on performance and customer service—both of which can help drive costs out of the supply chain.

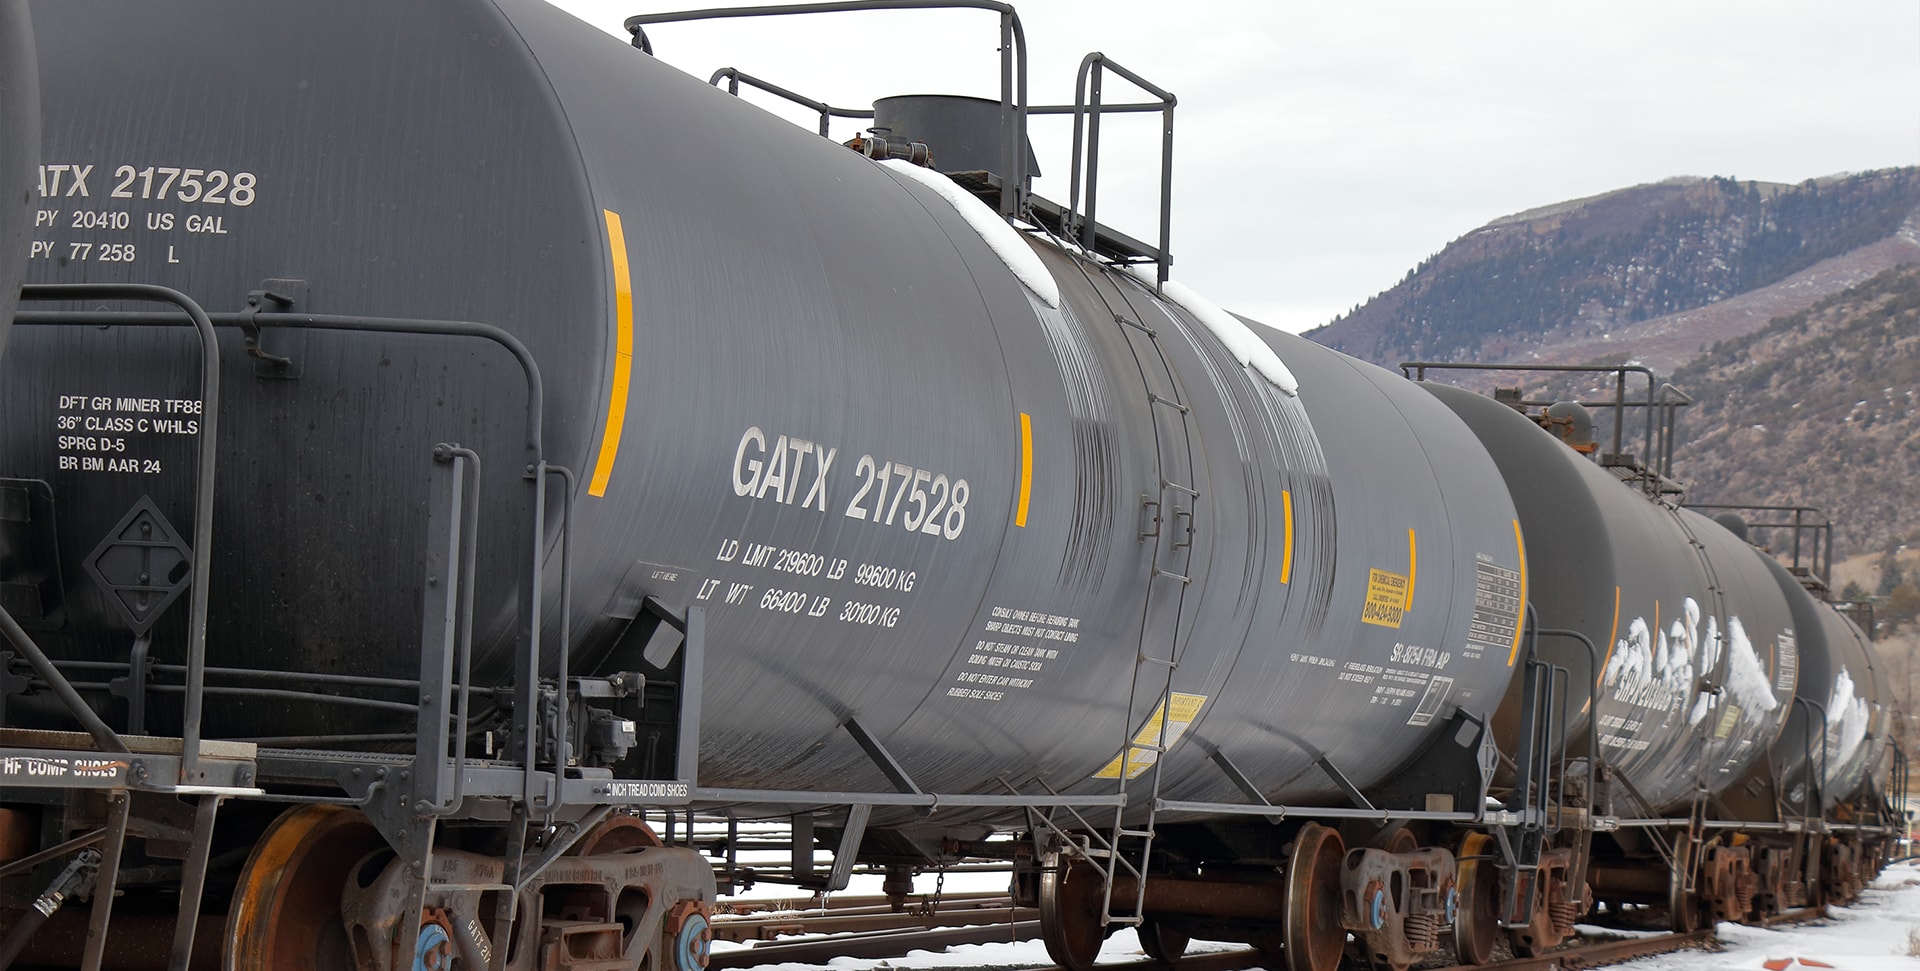
4) Identify points that aren’t visible to the naked eye. IntelliTrans recently worked with a company that sizing its rail car fleet. Historically, this process is done by:

• Assessing yearly demand
• Looking at average transit times for the year
• Determining how many rail cars are in bad shape and/or out of service
• Based on an average transit time of 8-12 days and demand of 1,000 rail cars per month, the company would plan for about 12,000 cars.

Using analytics, the company we were working with noticed that its transit times were shorter when it had a higher number of shipments. That could have been because carriers were performing better in answer to a higher volume of work, but whatever the impetus the end result was a company that could remove about 400 rail cars from its fleet. Based on an average cost of about $10,000 per car per year, that equated to a $4 million cost savings thanks to analytics.

5) Establish control mechanisms. To extract the biggest value from an investment in analytics, companies must use it on an ongoing basis—not just when times are tough or when they want to implement a specific improvement. For example, one company may want to know how many tons of product it can put in a rail car. This is an important metric for a firm working with per-car-shipped freight rates. That means the shipment costs $5,000 to move whether the rail car is carrying one pound of product or 200,000 pounds of product. The ultimate goal would be to maximize that weight on every shipment, but that’s difficult to attain without good analytics. Using IntelliTrans’ dashboard, for instance, companies can set their goals and then quickly glance at the screen to see what is and isn’t performing properly. This control mechanism can translate into significant supply chain savings over time.

    Drive the Costs Out of Doing Business

    In the current economic environment, all companies are looking for new ways to drive down operational costs. The supply chain is often a focal point during these exercises, and is often looked upon as more of a “cost center” than a hub for potential operational efficiencies and money savings. Using analytics, companies can flip that conversation, get better control over their supply chain processes, and drive the costs out of doing business.

    Putting the Data to Work

    IntelliTrans’ Global Control Tower provides high levels of supply chain transparency; aggregates, completes, and enhances data from a variety of sources; offers visibility into and execution of different aspects of the supply chain; and generates data-driven alerts and analytics that ask deeper questions and deliver meaningful insights.

    By leveraging tracking information, the Global Control Tower provides analytics that measures key performance indicators (KPIs) like fleet cycle time, origin/destination dwell time, lane and hauler performance, back orders, freight spend, load optimization, and more. With their rate, equipment, lease, tracking, and invoice data in a central repository that’s accessible 24/7, companies can position themselves for success in any market conditions.

    5 Reasons You Need a Holistic Supply Chain Approach

    5 Reasons You Need a Holistic Supply Chain Approach

    Getting to high levels of rail car and truck fleet visibility requires a holistic supply chain approach that doesn’t leave anything out.

    In the rapidly-evolving supply chain environment, companies can’t afford to have siloed technology platforms that don’t talk and collaborate with one another. To overcome the problem, many start “filling in” with manual processes that just create more confusion, errors, and rework. These “frankensystems” provide low levels of supply chain visibility in a world that demands 24/7 information about shipment statuses.

    “When working in silos, as many businesses do, it’s hard to get a view of the end-to-end supply chain,” the Institute for Supply Management (ISM) points out in Developing a Holistic Supply Chain View in a Digital Age. “But to transform amid the evolving digital supply management landscape, they need to develop that holistic view.”

    Having that view has become table stakes for both business-to-consumer (B2C) and business-to-business (B2C) shippers that want to provide high levels of customer service in a profitable, sustainable way. Bulk and break-bulk commodity shippers aren’t immune to these shifts and are continually seeking ways to apply technology in a smart, efficient manner.

    What’s the Big Deal?

    Many organizations don’t realize just how tightly intertwined the various aspects of the supply chain really are. For example, the correlation between the tracking of in-transit shipments and holding carriers accountable for on-time pickup/shipment scheduling isn’t always clear. So where the dock scheduling system may show that a rail shipment left on Tuesday at noon, if in-transit visibility doesn’t begin until the following morning, then the shipper has no idea if it actually left on time. 

    When this data isn’t linked, shippers never really know if a shipment left their sites on-time.

    These questions can only be answered by a system that unifies in-transit data and dock scheduling data on the same platform. Anytime those important data points are in siloed systems and operating independently of one another, supply chain visibility plummets.

    5 Reasons to Go Holistic

    Whether they learned this from Amazon, by using the Uber ride-sharing app, or by tracking their Domino’s pizza delivery via mobile app, people know that they can see where their orders are at any time. These tech-savvy consumers are also your customers. Mimicking these B2C operations is possible, but only with a holistic supply chain approach that incorporates advanced technology. Here are five more reasons to make this move:  

    1. More accurate invoice auditing and fewer overpayments. Without a unified system that supports invoice auditing, companies really don’t know if they’re paying the right price for a shipment, what their shipment identifier is, and/or if they’ve paid for the same shipment twice. With a unified platform, companies always know when a car is billed and not This allows them to address origin switch issues with carriers and improve on-time delivery. Preventing these billing issues also greatly enhances customer service and prevents the billing errors (i.e., when a rail car wasn’t moved on time).


    2. Improved inventory management. Inventory management is all about having the right stuff in the right place and at the right time. Without a centralized platform providing a holistic view of all inventory in the supply chain, companies wind up with too many stock-outs and overstocks. Both of these situations can be costly in a world where all companies are being asked to do more with less. IntelliTrans’ vendor managed inventory (VMI) solution uses sensors to measure how much bulk inventory a company has on-hand, how fast that inventory is being depleted, and when it’s time to reorder. The solution also shows exactly how much product is stored in the in-transit and yard-based rail cars. This is a big win for companies that would otherwise wind up creating a new order for product that’s stored out in their yards, but that they didn’t even know about.

    3. Fewer detention and demurrage fees. When a shipment arrives at its destination, it may sit around for a while before getting unloaded. This translates into detention fees for the shipper, which may not even know about the problem until that extra $200 fee shows up on a carrier invoice. In most cases, this happens because the shipment scheduled wasn’t connected to the customer’s inventory requirements and/or patterns. IntelliTrans’ tracking information and auditing expertise helps pinpoint extra fees and accessorials, and it also handles the dispute process. For one company alone, the system has identified over $600,000 in erroneous carrier charges within two months of implementation.


    4. B2B visibility for bulk and break-bulk shipments. If you can track the journey of an $8 toy purchased online throughout its lifecycle, then why can’t a wire manufacturer see where a truck carrying $80,000 worth of copper is at any given time? This is the question that buyers are asking themselves as B2C shipment visibility becomes the norm in the B2B sector. Thanks to the application of RFID tags in rail cars, that transportation mode has been able to offer high levels of shipment visibility for years. The electronic logging device (ELD) mandate pushed similar capabilities into the over-the-road trucking arena. By tying this information into a holistic supply chain platform, shippers can now answer the question that all of their customers are asking: Where’s my stuff?

    5. Stay agile in an uncertain economic environment. The economy has fluctuated about 10 times since World War II, with the current environment greatly impacting companies across all industries. The current downturn is no different. With companies laying off workers and shedding inventory to free up cash, the demand for on-time deliveries has increased dramatically in recent months. This, in turn, is driving the need for a more cohesive, centralized supply chain strategy that factors in all aspects of the network.

    A Clear View of Your Supply Chain

    IntelliTrans’ Global Control Tower provides high levels of supply chain transparency; aggregates, completes, and enhances data from a variety of sources; offers visibility into and execution of different aspects of the supply chain; and generates data-driven alerts and analytics that ask deeper questions and deliver meaningful insights.

    By leveraging tracking information, the Global Control Tower provides analytics that measures key performance indicators (KPIs) like fleet cycle time, origin/destination dwell time, lane and hauler performance, back orders, freight spend, load optimization, and more. With their rate, equipment, lease, tracking, and invoice data in a central repository that’s accessible 24/7, companies can position themselves for success in any market conditions.

    IntelliTrans Rail 101: Chapter 10

    IntelliTrans Rail 101: Chapter 10

    RAIL INDUSTRY OVERVIEW

    Bad Order Cars and Car Parts

    What does this term mean? Railcars are put into Bad Order Status during the transportation cycle when the car requires any repair to running gear or safety appliances. These running gears parts and safety appliances are wheels, trucks, brakes, air hoses, draft gear, couplers, ladders and platforms.

    Bad order for coupler repair is one of the more common reasons when checking on bad orders. The bad order status for couplers may mean the complete change out of the coupler or maybe just the coupler knuckle, which is the part that that moves in the center of the coupler and looks like a large steel hook. Couplers receive some of the hardest wear and tear on a railcar. This is due to the action of cars hitting each other during the process of blocking cars, moving them within plant locations, and the pressure put on the couplers during the act of pulling a train.

    The coupler pictured here is what is called a “Single Shelf Coupler”. A single shelf coupler is one that has only protection on the underside of the coupler to ensure that cars do not come uncoupled during movement of a train. The single shelf coupler is the most common type of coupler in use today and will be on cars that do not move any hazardous materials.

    For all railcars that move hazardous materials must be equipped with what is called “Double Shelf Coupler”. A double shelf coupler has protection above and below the coupler knuckle which limits the move of the coupler in either direction. This type of coupler is more time consuming to change as railroads may not always carry the different types of double shelf couplers and will have to order them from a supplier, which may cause a delay of a day or two in making the repair.

    A second type of running gear failure could be what is called “Draft Gear”. This is a part that is hidden behind the coupler and acts as a shock absorber for the coupler as cars are being blocked for movement.

    Due to where this is located the change out of a draft gear may also take longer than other types of repairs. The railroads may have these in stock at most repair tracks, however, as with double shelf couplers, there are many types of draft gear and the railroads may have to order the specific type required after they have removed it from the railcar making the time for the repair longer than might be expected.

    Wheels need to be replaced when one of two things happen. The surface face of the wheel develops a flat spot or the flange on the inside of the wheel no longer meets width requirements established by the AAR. In most cases these problems only happen on one wheel at a time. As the wheels are permanently attached to the axles both are changed out at the same time. This is a type of repair that is very common, is often repaired in a short amount of time, and the cars placed back into service.

    Other types of running gear that are often bad ordered repairs are yokes, air brakes, truck assemblies, springs, side frames and brake shoes. These are all very common items that need to be replaced during the movement of railcars and should be repaired with in a 48-hour time period.

    Railroads can repair the running gear on all cars and can repair body damage to all cars except tank cars. Tank car body damage must move to a home shop for repairs as railroad shops do not have the certification to do work on a tank structure.

    When cars are Bad Ordered by railroads how much time should one expect that the cars will be out of service?
    Major yards, such as East St. Louis, Chicago, Atlanta, Houston, New Orleans, Houston, and Bakersfield can require longer repair time. Expect up to 48 hours of additional time in these larger terminals due to the large volume of repair work that is done.

    Some rules of thumb for different types of Bad Orders are:
    • Bad Order for Safety Appliances, Springs and Wheels should be 48 to 72 hours from the time they went Bad Order to time car is released and ready to move forward.
    • Bad Orders for Trucks, Side Frames, Draft Gears and Couplers should be 72 to 96 hours as the shops may not have the correct parts for all types of cars, and they would have to be ordered from a supplier.
    • Bad Orders for Wheel and Bearing inspections, after a derailment, should be 48 hours, unless there are repairs that need to be accomplished.

    Derailments

    Derailments can be as simple as when the wheels come off the rail and rest on the ties or ballast and as serious as when railcars have been involved in an accident.

    The following pictures show various derailments. The first pictures show a derailment that would be classified as minor in nature. The cars have come off the rail and one car resting on the other; however, neither car received damage that would cause the cars to be delayed. They can be put back on the rail and after inspection will move onto the customer for unloading prior to the railcar being moved to non-railroad shop for inspection and possibly repair to the cars.

     As can be seen the cars have been scattered over the track and could cause problems for homeowners in the area.

    Major derailments such as this have deep impacts on railroad customers.

    After derailments of a minor nature, such as the wheels came off the rail; railcars are inspected for bearing and wheel damage. When cars have been re-railed, they must move to the railroad repair shop for inspection and release before they can continue to move.

    Railroads can repair the running gear on all cars and can repair body damage to all cars except tank cars. Tank car body damage must move to a home shop for repairs as the railroad shops do not have the certification to do any work on the tank structure. 

    IntelliTrans Rail 101: Chapter 9

    IntelliTrans Rail 101: Chapter 9

    RAIL INDUSTRY OVERVIEW

    Locomotives

    A Locomotive is a diesel electric power plant form of energy that provides horsepower and the tractive effort to pull trains.  Tractive effort is a measurement of locomotive power.  Locomotives come in all different sizes and are meant for different types of jobs. 

    The following chart lists a very simple description of types of locomotives in use today.  The difference between a yard switcher and road engine is the amount of horsepower the locomotive produces.  Locomotives range in horsepower from 2500 to over 7000.  The smaller ones are used in switching service in yards where only a few cars at a time are moved.  Larger locomotives are used in the long-haul movement of trains with 50 to 100 cars per train.

    YARD SWITCHER

    Smaller, less horsepower, windows provide 360 degree view

    MOTHER & SLUG (COW & CALF)

    Power of Mother locomotive, connected to the Slug, to provide more traction

    ROAD ENGINES, DC & AC, AC6000

    High horsepower pulls more tonnage per unit

    Locomotives can run just as fast in either direction. With this there is no “front” or “rear” to a locomotive and we will see locomotives sitting in configurations that would seem to be back to back or front to front.

    Carry spare knuckles and air hoses. This is only the front part of the coupler for the locomotive only as well as the air hoses that will connect the locomotive to the first railcar.

    Fuel tank runs from side to side – holds approximately 4000 gallons of fuel.

    Fuel is the largest expense, with payroll second.

    Cabooses

    Cabooses are what we all looked forward to seeing as the trains moved by and if we were lucky, we could get the conductor to give us a wave as the end of the train moved by. Although this is what most of us think of when thinking of cabooses, it is not the reason why the cabooses were first used and used for so many years. Cabooses were used as a rolling home for the train crews; it allowed them to have a home away from home and a mobile office for the operation of the trains. Today cabooses are used very rarely and mainly used by local industry trains when there is a need for a train crew to ride on the rear of the train to operate switches or provide crossing protection when needed. The uses of cabooses began to disappear in the 1980’s and are being replaced by a new technology called an End of Train Indicator (EOT).

    End of Train Devices

    End of Train Devices are a portable telemetry device mounted on the last car of a train to transmit information to a receiver display unit on the engine. It serves as a marker to identify the end of the train and transmits air pressure and motion information. Effective July 1, 1997 trains operating 30mph or greater must have and EOT device. End of Train Device may also be called EOT – End of Train Indicator, ETD – Electronic Train Device, LIGHT, FLASHER, REAR DEVICE or RED LIGHT.

    The EOT must be connected correctly to operate properly. The following pictures show an EOT that is connected correctly and one that is not.

    IMPROPERLY CONNECTED

    This EOT is not properly connected; we see that the air hose and electronic connection are dangling on the ground thereby not allowing the either connection to work as they should and provide the safety they are intended. 

    PROPERLY CONNECTED

    Here is an EOT device that is properly connected and providing the motion detection and air pressure for safe operations. 

    IntelliTrans Rail 101: Chapter 8

    IntelliTrans Rail 101: Chapter 8

    RAIL INDUSTRY OVERVIEW

    Railcar capacities and Plate designations

    As cars are loaded and billing is given to the carriers, the shipper must provide a loaded weight so that the railroad can determine if it can move safely. Sometimes this is done by the railroad weighing the car and advising the shipper of the loaded weight, but more often today it is done by what is called a Weight Agreement. A Weight Agreement is when shipper and carrier agree to use the shippers’ weights for the move without weighing the car prior to movement.

    As the railroads close more and more scales across their systems, the ability to have a car weighed prior to billing is almost impossible. In most instances the only time a car is weighed is when they are being blocked in a hump yard. The first time this can happen, in many moves, is several hundred miles after the origin point. If the car is then found to be overweight the shipper will have to make arrangements to have some of the load transferred to another car before it will be allowed to continue forward. This can be a very expensive problem for shippers to deal with, which makes the weight information important. Other reasons why the weight information is important are for Regulatory Compliance as well as claim resolution.

    The dimension information that is stenciled on the cars gives the extreme heights, widths, inside lengths and inside height. The following is a description of what each of the dimension marks mean:

    EXW

    Extreme width at the widest part of the car
     

    EXH

    Extreme height is the highest part of the car from base of rail to top of the car, excluding attachments

    EW

     The eaves width is the outside width of the car at the edge of the eaves

    EH

    The Eaves height is measured from the top of the rail to the eaves Inside Dimensions

    L

    Inside Length

    W

    Inside Width

    H

    Inside Height

    Looking at the side of the car gives all the information needed when loading a box car for movement.

    All cars that move today also show what is called the Plate Size of the car.  Plate size is used to avoid collisions with fixed structures (buildings, tunnels and bridges) and is also used to designate the railcar’s proper route.  The plate size of a car is stenciled on the door to give a visible indication of the size of a railcar. Cars of excessive dimensions may require clearance authority from the respective railroad’s Clearance Bureau before they can run in certain areas.  

    Plate B is the smallest and can run anywhere in North America and does not require clearance authorization. You will find that most of the Plate B clearances are in the New York and New Jersey area and are due mainly to the congested New York corridor.  

    Plate C can run on 95% of tracks in North America, anything outside the Plate C dimensions will have to be cleared for the route of movement to ensure that bridges, tunnels, etc. do not cause problems with the loads.  Mostly you will find oversized loads requiring clearances to be moving on flat cars, but there are instances where extremely large tank cars and hopper cars may require clearances to move. 

    X Your amount is: Request Demo